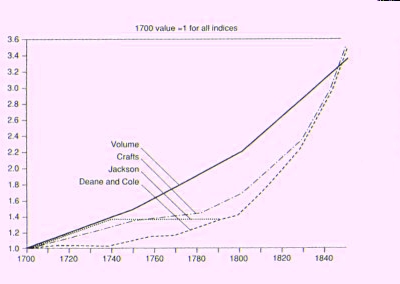
A graph representing the different views on the growth on English agriculture during the 18th and 19th centuries.
The axis should be labelled:
Y axis- Indices of agricultural output 1700-1850, 1700 value = 1 for all indices
X axis- Time

A graph representing the different views on the growth on English agriculture during the 18th and 19th centuries.
The axis should be labelled:
Y axis- Indices of agricultural output 1700-1850, 1700 value = 1 for all indices
X axis- Time
